Posted by Stan Carney on Oct 3, 2012 in Programming |
We had a few extra monitors kicking around the office and, rather than just letting them sit there, I decided it would be good to use them as dashboards to communicate important information to the rest of the company. I figured that if live production stats were broadcast throughout the office it would help focus people’s efforts while at the same time building a sense of unity.
Four low profile VESA monitor mounts ordered off of Amazon, some HDMI to DVI cables and mini display port to HDMI adapters off Monoprice, and a pair of Radeon 6950’s I had from Bitcoin mining last year and I was all set. Setting up Google Analtyics Real Time stats on the first screen was pretty easy, unfortunately I couldn’t automate everything easily, like navigating to the correct tab. Starting x11vnc on each display solved the problem as it allowed me to connect to the UI and change what I needed to after boot. The Display Wall plug-in for Jenkins provides a simple build status metric.
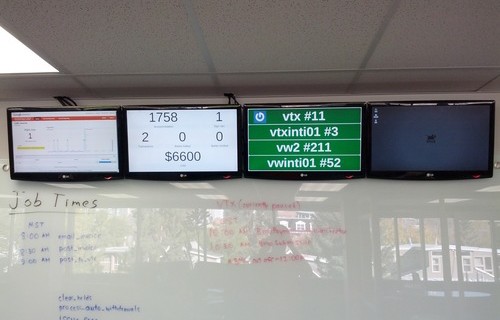
Testing with fake data
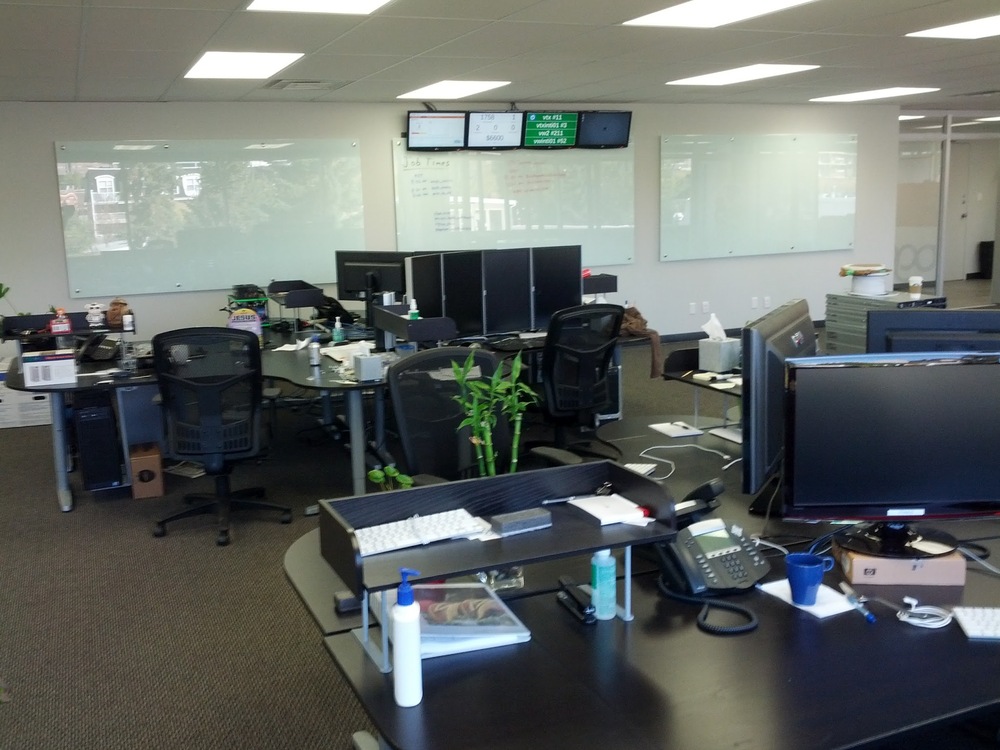
View from office
After getting the displays plugged in the correct order, always harder than it seems, I sorted out a few scripts that execute when the dashboard user logs in on boot.
#!/bin/sh

x11vnc -forever -display :0.0 -bg -q -rfbport 5900 -xwarppointer
x11vnc -forever -display :0.1 -bg -q -rfbport 5901 -xwarppointer
x11vnc -forever -display :0.2 -bg -q -rfbport 5902 -xwarppointer
x11vnc -forever -display :0.3 -bg -q -rfbport 5903 -xwarppointer

DISPLAY=:0.0 chrome --kiosk https://www.google.com/analytics/web/?hl=en#realtime/rt-overview/5345wrasf34q34534wfwer234we/ &
DISPLAY=:0.1 chrome --kiosk http://192.168.6.185:8080/ &
DISPLAY=:0.2 chrome --kiosk http://redmine:8080/jenkins//plugin/jenkinswalldisplay/walldisplay.html?viewName=All\&jenkinsUrl=http%3A%2F%2Fredmine%3A8080%2Fjenkins%2F &#!/bin/sh
exec /opt/google/chrome/google-chrome --enable-greasemonkey --enable-user-scripts --enable-extensions --user-data-dir=/home/dashboard/.config/google-chrome/$DISPLAY "$@"At first I thought about adding an RSS feed to fetch stats from production but that would require clients to poll for new information. Using something closer to realtime would allow the playing of audible alerts. Some people in the office don’t have a direct view to the monitors and in reality people will only glance at them once and awhile anyway. I thought playing a subtle sound, like a heartbeat, when an activity such as a signup occured would be a good way to give people a feel of how the running system is performing without having to stare at the screen. A quick Node.js app using Webaudio.js and Socket.io and I was done.
<html>
<head>
	<title>Vogogo Stats</title>
	<script src="//code.jquery.com/jquery-latest.js"></script>
	<script src="/socket.io/socket.io.js"></script>
	<script src="//cdnjs.cloudflare.com/ajax/libs/twitter-bootstrap/2.1.1/bootstrap.min.js"></script>
	<script src="https://raw.github.com/jeromeetienne/webaudio.js/master/build/webaudio.js"></script>
	<link rel="stylesheet" href="http://cdnjs.cloudflare.com/ajax/libs/twitter-bootstrap/2.1.1/css/bootstrap.min.css"/>

	<style type="text/css">
		.label {
			font-size:300%;
			padding:10px;
			line-height:100%;
			text-align:center;
		}
		.value {
			font-size:1500%;
			padding:10px;
			line-height:100%;
			text-align:center;
		}
	</style>

	<script>
		document.addEventListener("DOMContentLoaded", function() {
			var webaudio = new WebAudio();
			var signup_sound = webaudio.createSound();
			signup_sound.load('/sounds/heartbeat.mp3', function(){
				signup_sound.loaded = true;
			});

			var bank_added_sound = webaudio.createSound();
			bank_added_sound.load('/sounds/car_start.mp3', function(){
				bank_added_sound.loaded = true;
			});

			var bank_verified_sound = webaudio.createSound();
			bank_verified_sound.load('/sounds/car_accelerate.mp3', function(){
				bank_verified_sound.loaded = true;
			});

			var socket = io.connect('/');

			socket.on('total_account_holders', function (data) { update('total_account_holders', data); });
			socket.on('signups_today', function (data) { update('signups_today', data, signup_sound); });
			socket.on('banks_added_today', function (data) { update('banks_added_today', data, bank_added_sound); });
			socket.on('banks_verified_today', function (data) { update('banks_verified_today', data, bank_verified_sound); });
			socket.on('transactions_today', function (data) { update('transactions_today', data); });
			socket.on('cad_today', function (data) { update('cad_today', data); });

			function update(id, value, sound){
				var element = document.getElementById(id);
				if(element.innerHTML != '' && sound && sound.loaded) sound.play();
				element.innerHTML = value;
				disconnected = false;
			}

			function getById(id){ return document.getElementById(id);}

		});
	</script>
</head>
<body>
	<div class="row-fluid">
		<div class="span8">
			<div id="total_account_holders" class="value"></div>
			<div class="well label"> Account Holders </div>
		</div>
		<div class="span4">
			<div id="signups_today" class="value"></div>
			<div class="well label"> Sign Ups </div>
		</div>
	</div>
	<div class="row-fluid">
		<div class="span4">
			<div id="transactions_today" class="value"></div>
			<div class="well label"> Transactions </div>
		</div>
		<div class="span4">
			<div id="banks_added_today" class="value"></div>
			<div class="well label"> Banks Added </div>
		</div>
		<div class="span4">
			<div id="banks_verified_today" class="value"></div>
			<div class="well label"> Banks Verified </div>
		</div>
	</div>
	<div class="row-fluid">
		<div class="span12">
			<div class="value">$<span id="cad_today"></span></div>
			<div class="well label"> CAD </div>
		</div>
	</div>
</body>
</html>var nconf = require('nconf');
nconf.argv()
.env()
.file({ file: "config.json" });
var app = require('http').createServer(main)
, static = require('node-static')
, io = require('socket.io').listen(app)
, pg = require('pg')
, fs = require('fs')
, moment = require('moment');
app.listen(8000);
var total_account_holders = 0;
var signups_today = 0;
var banks_added_today = 0;
var banks_verified_today = 0;
var transactions_today = 0;
var cad_today = 0;
var fileServer = new static.Server('./public');
pg.connect(nconf.get('db_connection'), function(err, client) {
client.pauseDrain();
setInterval(function() {
var today = moment().startOf('day').format('YYYY-MM-DD');
client.query("select count(id) as c from accountholder ah where ah.date_deleted is null;", function(err, result) {
if(result && total_account_holders != result.rows[0].c) {
total_account_holders = result.rows[0].c;
io.sockets.emit('total_account_holders', total_account_holders);
}
});
client.query("select count(id) as c from signups e where e.event_type = 'SIGNUP' and e.date >= $1;", [today], function(err, result) {
if (result && signups_today != result.rows[0].c) {
signups_today = result.rows[0].c;
io.sockets.emit('signups_today', signups_today);
}
});
client.query("select count(id) as c from account a where a.account_type = 'BANK' and a.date_created >= $1;", [today], function(err, result) {
if (result && banks_added_today != result.rows[0].c) {
banks_added_today = result.rows[0].c;
io.sockets.emit('banks_added_today', banks_added_today);
}
});
client.query("select count(id) as c from account a where a.account_type = 'BANK' and verified_date >= $1;", [today], function(err, result) {
if (result && banks_verified_today != result.rows[0].c) {
banks_verified_today = result.rows[0].c;
io.sockets.emit('banks_verified_today', banks_verified_today);
}
});
client.query("select count(id) as c from payment p where p.posting_date >= $1;", [today], function(err, result) {
if (result && transactions_today != result.rows[0].c) {
transactions_today = result.rows[0].c;
io.sockets.emit('transactions_today', transactions_today);
}
});
client.query("select sum(p.amount) as c from payment p where p.currency = 'CAD' and p.posting_date >= $1;", [today], function(err, result) {
if (result && cad_today != result.rows[0].c) {
cad_today = result.rows[0].c;
io.sockets.emit('cad_today', cad_today);
}
});
}, 100);
});
io.sockets.on('connection', function (socket) {
update(socket);
});
function update(socket) {
socket.emit('total_account_holders', total_account_holders);
socket.emit('signups_today', signups_today);
socket.emit('banks_added_today', banks_added_today);
socket.emit('banks_verified_today', banks_verified_today);
socket.emit('transactions_today', transactions_today);
socket.emit('cad_today', cad_today);
}
function main(req, res) {
req.addListener('end', function () {
fileServer.serve(req, res);
});
}

 I'm an idea developer. I'm also the Co-Founder, CTO of Redfall Technologies and Vogogo.com. I design and implement online payment systems, specifically online wallets, NACHA, Canadian Payments Association and credit card processing. I also dabble in all things technical.
Recent Comments